
Forex Entry Point Strategies are critical for maximizing profits and minimizing risks. These methods guide traders on when to enter the market.
In the dynamic arena of Forex trading, pinpointing the optimal entry point is a cornerstone of successful strategies. Traders employ a variety of indicators and chart patterns to identify the best moments to execute trades. A well-calculated entry point can significantly enhance the potential for profit while a poor choice can lead to unnecessary losses.
The integration of technical analysis, fundamental factors, and market sentiment is often key to developing robust Forex entry strategies. Tailoring these strategies to fit individual trading styles and risk tolerances is paramount for long-term success in currency markets.
The Essence Of Forex Entry Points
Understanding where to enter a trade in the highly volatile Forex market is key to success. Forex entry points are crucial moments. They can mean the difference between profit and loss. Recognizing the ideal time to enter the market sets up traders for potential gains.
Timing The Market
Timing is everything in Forex trading. Traders look for signs that a currency pair is set for an upward or downward shift. The goal is to join the market at the start of these movements. The right entry point aligns with market trends and economic events. It should also match with a trader’s strategy and risk tolerance. Deciding on the perfect moment requires insight and precision.
The Role Of Technical Indicators
Traders often rely on technical indicators to pinpoint entry points. These tools provide data-driven insights into market behavior. There are several types of indicators. Some measure momentum, others track trends, and more identify volatility. They help traders analyze charts and graphs to make informed decisions. Below, common technical indicators are listed:
- Moving Averages (MAs)
- Relative Strength Index (RSI)
- Stochastic Oscillator
- MACD (Moving Average Convergence Divergence)
- Bollinger Bands
Each indicator has its unique role. For instance, Moving Averages smooth out price action. This allows traders to identify trends. RSI, on the other hand, indicates if a currency pair is overbought or oversold. This helps traders gauge reversal points.
Credit: tradingstrategyguides.com
Analyzing Market Trends
For successful Forex trading, understanding the market’s direction is key. The ‘Analyzing Market Trends’ section explores how to spot these vital signs. This insight helps traders determine the best entry points. Traders must grasp these patterns for effective strategy building.
Identifying Upward And Downward Movements
The first step in trend analysis is spotting which way the market leans. An upward trend means a currency is gaining value. Traders see higher highs and higher lows. A downward trend signals the opposite; it shows a currency losing value. This trend has lower highs and lower lows. Recognizing these movements is crucial. Traders gain the upper hand by entering trades aligned with these trends.
Price charts reveal trend directions clearly. They show the ongoing battle between buyers and sellers. Each candle or bar hints at who is winning. Steady upward ticks indicate buyers are in control. Conversely, steady downward ticks point to a seller’s market. This visual data is vital for making smart entry choices.
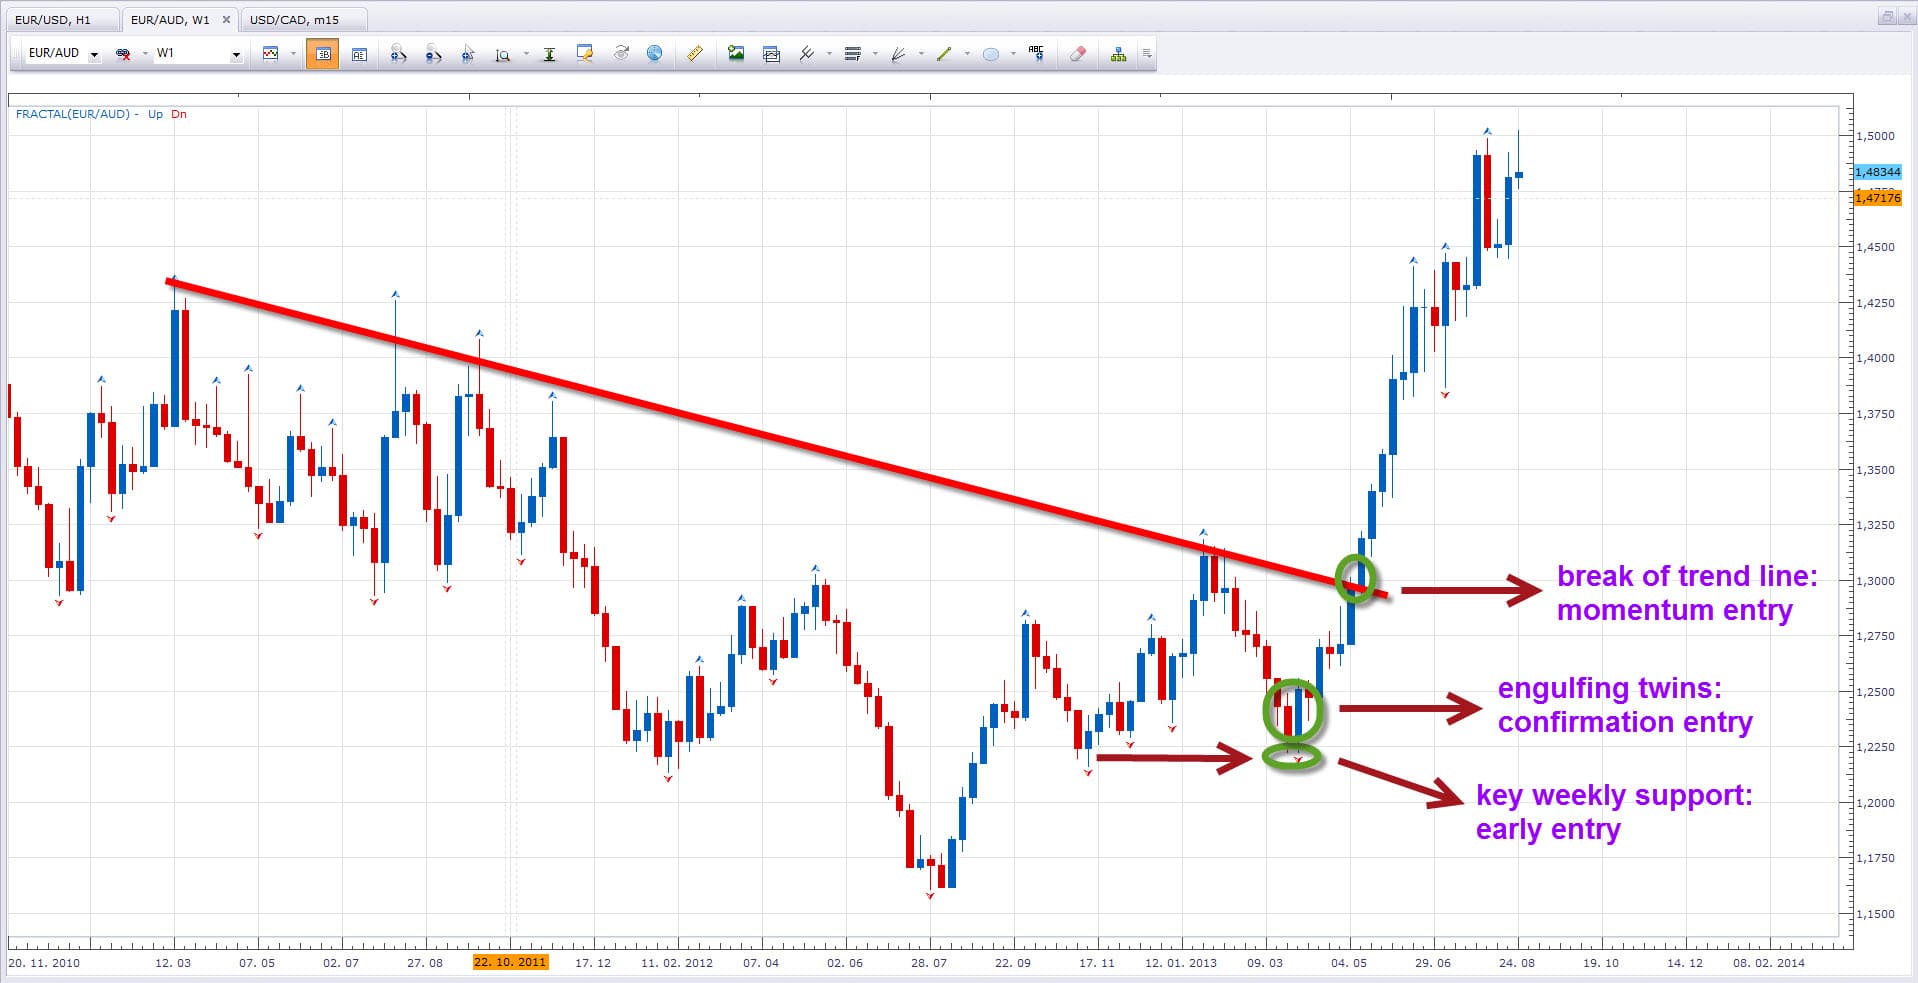
Significance Of Trend Lines
Trend lines are simple yet powerful tools in Forex. They connect multiple price points, creating a visual guide. Traders use these lines to analyze market momentum. When price respects a trend line, it confirms the trend’s strength. A trusted trend line can signal the perfect entry opportunities.
Boldly drawn trend lines act as barriers. They show potential areas of support or resistance. A break through these lines can indicate a significant trend change. Cautious traders watch for these breaches. They help highlight high-potential entry or exit points.
- Trend lines slope up for an uptrend.
- Downtrends are marked by downward sloping lines.
In summary, market trends are the compass for Forex traders. They point to where the money flows. Identifying trend direction and using trend lines sharpens trading skills. Stay tuned to these market rhythms to find the best Forex entry points.
Candlestick Patterns And Entry Signals
Candlestick Patterns and Entry Signals are like secret codes on a Forex chart. They tell a trader when to jump into the market or step out, helping to make smart moves. Mastering these patterns is like learning the language of the market. Let’s dive into some popular patterns and understand how they signal entry points.
Common Bullish And Bearish Patterns
Traders spot patterns to predict if the price will go up or down. Think of it like watching clouds and predicting rain.
- Bullish Engulfing – Like a bear hug, it wraps around a small, negative candle. It means traders are going all-in on buying, pushing prices up.
- Bearish Engulfing – The opposite of a bear hug, a bigger, gloomy candle swallows a smaller, happy one. It hints that sellers are taking control.
- Hammer – Imagine a hammer’s shape on the chart, which tells you the price might hammer its way up.
- Shooting Star – Like a star falling from the sky, this pattern suggests prices might drop soon.
Confirming Reversals And Continuations
Once a pattern appears, don’t jump in right away. It’s like seeing footprints and checking if they’re fresh. Are more traders following the pattern?
| Pattern | What to Check | What it Means |
|---|---|---|
| Doji | Is it after a long trend? | Traders can’t decide; the price might turn around. |
| Bullish Harami | Is the volume increasing? | Confidence is building; prices may rise. |
| Bearish Harami | Did it appear at a peak? | It’s a red flag; traders might start selling. |
| Continuation Patterns | Are similar patterns repeating? | The trend is your friend; it’s likely to keep going. |
Adding indicators like moving averages or RSI can double-check signals. It’s like asking a friend before making a big move.
Critical Role Of Support And Resistance
The support and resistance levels in Forex markets serve as the foundation for successful entry point strategies. Traders use these key price levels to make critical decisions on when to enter and exit trades. Support acts as a floor where prices find difficulty falling below, while resistance works as a ceiling limiting how high prices can rise. An understanding of these principles is essential for navigating the Forex market effectively.
Finding Reliable Levels
Determining strong support and resistance levels is an art that requires careful analysis. Traders often look at historical price data, seeking areas where prices have repeatedly bounced or reversed course. These levels act as psychological barriers in the minds of traders, making them more reliable for future trades. Essential tools for this task include:
- Trend lines
- Pivot points
- Fibonacci retracement levels
Traders should seek confirmation through multiple indicators to ensure the levels they find are dependable.
Breakout Vs. Bounce: Entry Tactics
The choice between trading a breakout or a bounce hinges on a trader’s read of market momentum and support/resistance strength. Breakouts occur when price action moves beyond a resistance level, potentially indicating the start of a new trend. Meanwhile, bounces happen as prices rebound off support or resistance levels, hinting at a continuation of the current trend.
Entry points for these strategies typically include:
| Strategy | Entry Point |
|---|---|
| Breakout | Just above resistance level |
| Bounce | Near support level |
This simplifies the approach by deciding to buy on breakouts or sell on bounces, making strategic decisions clear-cut.
Moving Averages In Forex Trading
Moving averages stand as fundamental tools in Forex trading. These simple yet powerful indicators help traders spot trends and potential reversals. By averaging currency price data over a specific period, these lines smooth out short-term fluctuations. This offers a clearer view of the overall trend.
Types And Settings
Differences in types and settings of moving averages affect their responsiveness. The two main types are:
- Simple Moving Average (SMA): a straightforward average of prices over a set period.
- Exponential Moving Average (EMA): gives more weight to recent prices, making it more responsive to new information.
Settings refer to the time period chosen. Common settings include 50, 100, and 200 periods. Shorter settings respond faster to price changes. Longer settings offer a smoother line that’s less sensitive to price spikes.
Crossovers As Entry Signals
A crossover occurs when two moving averages intersect. Many traders view this as a sign to enter a trade.
| Type of Crossover | Signal |
|---|---|
| Golden Cross | A shorter moving average crosses above a longer one, signaling a potential long entry. |
| Death Cross | A shorter moving average crosses below a longer one, signaling a potential short entry. |
Applying EMAs can produce more timely signals due to their focus on recent prices. Traders often employ 12-period and 26-period EMAs for these strategies.

Credit: www.dailyfx.com
Risk Management And Entry Strategies
In the exciting world of Forex trading, entry and exit points can make or break a trade. It’s vital to have a solid strategy. Risk management is the backbone of trading. This post explores key tactics for entering the Forex market while wisely managing risks.
Setting Stop-loss Orders
A stop-loss order is a trader’s safety net. It limits potential losses. This order closes a trade at a preset price level. It’s an essential tool for risk strategy. Proper placement of stop-loss orders depends on volatility and personal risk tolerance.
Here’s how to set a stop-loss order effectively:
- Analyze the currency pair’s average daily range for guidance.
- Consider recent market behavior and support/resistance levels.
- Factor in your account size and how much you’re willing to risk.
Calculating Optimal Entry Size
Position sizing is key to managing risk. It helps you stay in the game. You control how much you’re willing to risk on a single trade.
Use these steps for sizing positions:
- Decide on the percentage of your account to risk. 1-2% is common.
- Calculate the stop-loss distance in pips.
- Use the risk percentage and stop-loss to find the right position size.
Here’s a simple formula:
| Account Size | Risk Percentage | Stop-Loss (pips) | Position Size |
|---|---|---|---|
| $10,000 | 1% | 50 pips | Calculate this based on your broker’s lot size |
By adjusting your position size, you manage the risk. This tailored approach keeps your trading account healthy. It optimizes growth potential while protecting your funds.
Fusing Fundamental Analysis With Entry Points
Successful Forex trading hinges on the strategic blend of technical and fundamental analysis. Fusing fundamental analysis with entry points ensures a robust approach to the volatile Forex market. This technique enables traders to interpret economic indicators with precision timing to optimize trade entries and exits.
Economic Indicators That Influence Forex
Various economic indicators play pivotal roles in the Forex market:
- Gross Domestic Product (GDP): GDP figures can prompt market volatility and provide trade opportunities.
- Employment Data: Nonfarm Payrolls and unemployment rates significantly affect currency value.
- Inflation Data: Consumer Price Index (CPI) and Producer Price Index (PPI) guide interest rate moves.
- Central Bank Decisions: Interest rate changes and quantitative easing influence currency strength.
Integrating News Releases Into Entry Strategy
News releases are critical for timely Forex entries. Traders exploit these events for potential breakouts or trend reversals:
- Analyze the economic calendar for key announcement times.
- Prep for volatility by setting entry orders prior to news release.
- Observe initial reaction, then refine entry points once the dust settles.
Use real-time news sources for instantaneous updates to maintain an edge.

Credit: honeypips.com
Frequently Asked Questions On Forex Entry Point Strategies
What Is A Forex Entry Point?
A Forex entry point is the price level at which a trader decides to open a position in the foreign exchange market.
How To Identify Forex Entry Points?
Identifying Forex entry points typically involves analyzing technical indicators, chart patterns, and economic events to determine optimal trade initiation.
What Are Common Forex Entry Strategies?
Common Forex entry strategies include support and resistance levels, moving averages, trend lines, and price action signals.
Can News Impact Forex Entry Points?
Yes, significant news events can influence currency valuations and create volatility, thereby impacting Forex entry points.
What Are The Best Indicators For Entry Points?
Popular indicators for entry points in Forex are the Relative Strength Index (RSI), Moving Average Convergence Divergence (MACD), and Stochastic Oscillator.
Is Timing Important In Forex Entry?
Timing is crucial in Forex trading, as entering a trade at the right moment can significantly affect the profitability of a position.
How Does Leverage Affect Entry Points?
Leverage can amplify both profits and losses, so traders must be cautious when deciding entry points to manage risk effectively.
What Role Does Risk Management Play In Entry Points?
Risk management is vital to protect capital; setting stop-loss orders near entry points can limit potential losses on trades.
Can A Forex Entry Strategy Be Automated?
Yes, traders can automate entry strategies using trading software that executes trades based on predefined criteria.
How To Backtest Forex Entry Strategies?
Backtesting involves applying entry strategies to historical data to assess their effectiveness before implementing them in live trading.
Conclusion
Mastering Forex entry point strategies is crucial for trading success. Adaptability and continuous learning set top traders apart. Embrace these methods, refine your approach, and watch your trading performance improve. Remember, practice makes perfect. Equip yourself to seize those profitable opportunities in the ever-dynamic Forex market.