
Forex candlesticks depict price movement within a specific timeframe. They offer visual insight into market sentiment and potential reversals.
Forex trading often involves analyzing market patterns through various tools, and one of the most essential instruments at a trader’s disposal is the Forex candlestick chart. It’s a highly visual means of representing price movements on a Forex chart, providing a clear picture of the currency pair’s performance over a chosen period.
Each candlestick on the chart details the opening, closing, high, and low prices, giving traders a snapshot of market conditions. The color and size of the candlesticks help in detecting volatility and forecasting possible future trends. As a fundamental aspect of technical analysis, understanding candlestick patterns equips traders with the ability to make informed decisions in the fast-paced world of currency trading. Traders continually harness the power of candlesticks to refine their strategies, recognizing patterns like ‘dojis’ and ‘hammers’ that signal shifts in market dynamics.
The Basics Of Forex Candlesticks
Forex candlesticks are a visual representation of price movements. Traders across the globe use these handy tools to gauge market sentiment swiftly. These charts offer insights into the open, high, low, and close prices for a given time frame. Understanding candlesticks is vital for anyone looking to navigate the Forex markets effectively.
Origins Of Candlestick Charting
The birth of candlestick charting dates back to 18th century Japan. A rice merchant named Munehisa Homma developed this technique. He wanted a better way to track market prices. Over time, these charts reached the West. Traders quickly noted their value in various markets, including Forex.
Anatomy Of A Candlestick
Each candlestick tells a story. It’s a snapshot of market activity during a specific period. Let’s break down the parts:
- Body: Shows the difference between the opening and closing prices.
- Wick/Shadow: Indicates the high and low prices.
- Color: Reveals the direction of price movement. Typically, a green or white body means the price closed higher than it opened. A red or black body indicates the opposite.
By examining these elements, traders spot patterns. These patterns can predict future price movements. Common patterns include:
- Bullish Engulfing: Potentially indicates an upward trend.
- Bearish Engulfing: Could signal a downward trend.
- Doji: Suggests uncertainty or a potential trend change.
| Color | Meaning |
|---|---|
| Green/White | Price increased. |
| Red/Black | Price decreased. |
Interpreting Candlestick Patterns
Forex candlesticks pack big data in tiny symbols. Each shape and color tells a market story. They show a currency pair’s opening, high, low, and closing prices. Understanding these patterns helps traders predict future moves. Let’s dive into the art of reading these informative patterns.
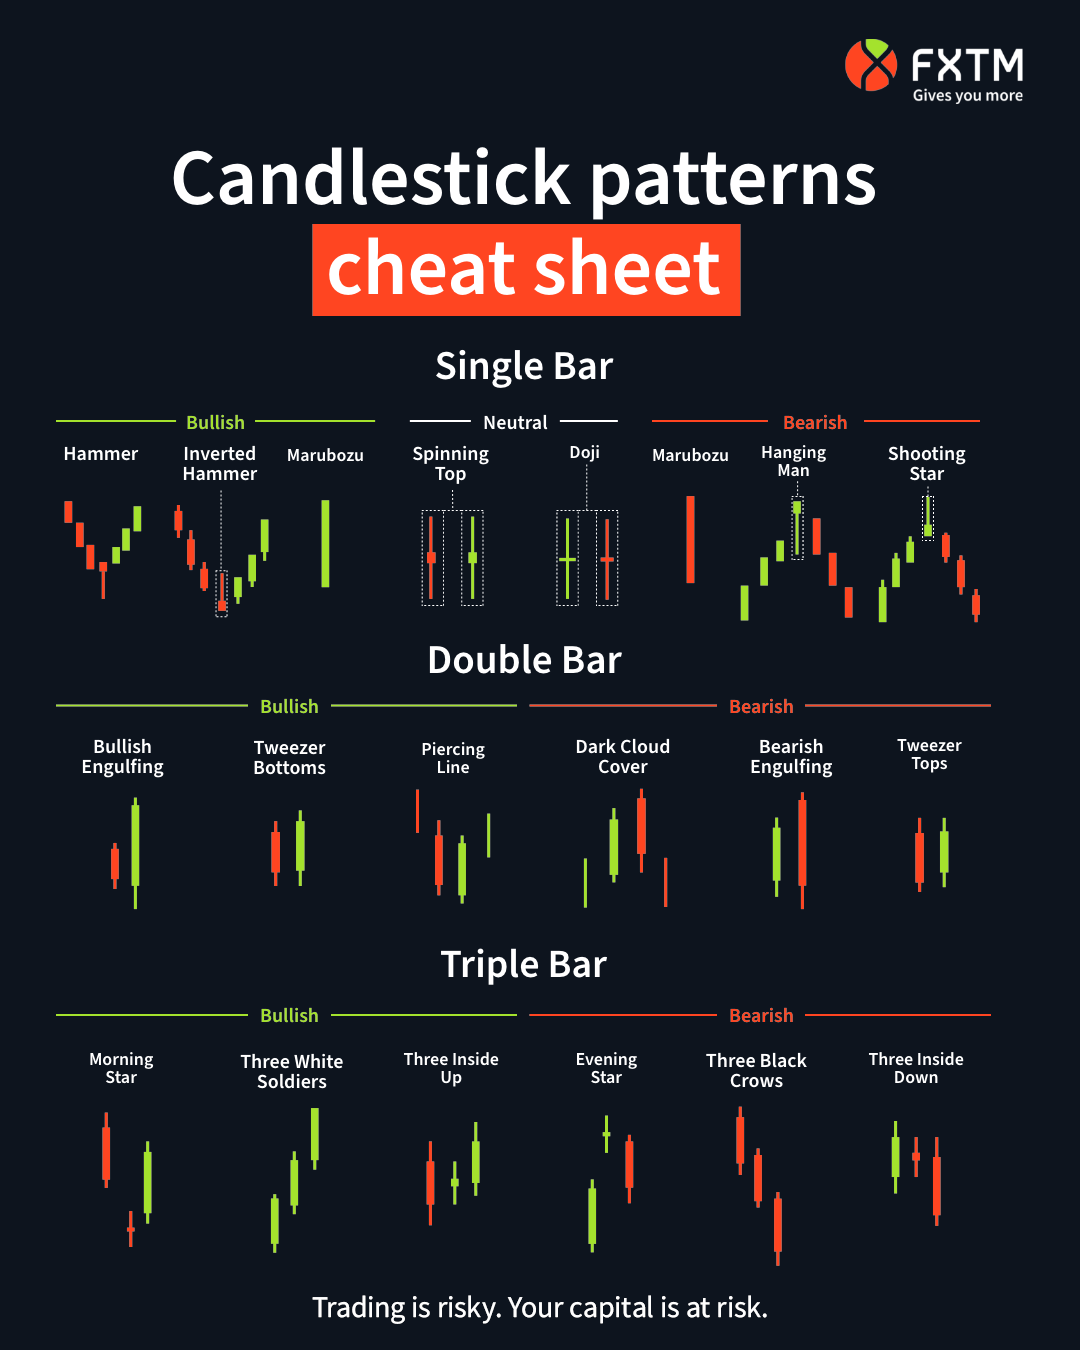
Single Candlestick Patterns
Forex trading thrives on quick, smart decisions. Spotting single candlestick patterns is a skill. These formations may hint at trend reversals or continuations. We look for tell-tale signs in single candles.
- Doji: A sign of indecision in the market. It has a cross-like shape where opening and closing prices are almost the same.
- Hammer: Indicates that buyers are starting to push the price up. It looks like a hammer, with a short body on top and a long wick below.
- Shooting Star: Bears may take over. This pattern looks like an inverted hammer and appears at an uptrend’s end.
- Inverted Hammer: Bullish reversal pattern. It points upwards, suggesting buyers might regain control.
- Engulfing: A sign of a potential reversal. The body of this candle completely engulfs the previous one’s body.
Complex Candlestick Formations
Some patterns take more than one candlestick to form. Called complex formations, they offer stronger price movement signals. Let’s look at some:
| Pattern | Description |
|---|---|
| Morning Star | A three-candle bullish reversal pattern. It starts with a long bearish candle, follows with a short candle, and ends with a long bullish candle. |
| Evening Star | The bearish counterpart to the Morning Star. It signals a potential downward trend with a similar three-candle setup. |
| Three Black Crows | Reflects bearish sentiment. It features three long, black candles descending stepwise. |
| Three White Soldiers | The bullish version of Three Black Crows. It shows rising optimism with three long, white candles ascending. |
By understanding both the single and complex candlestick formations, traders can craft smarter strategies. They use these patterns to forecast market moves and make informed trades.
Bullish Vs. Bearish Signals
Traders often use Forex candlesticks to gauge market sentiment. These simple yet powerful visual tools reflect the ongoing battle between bulls and bears. Understanding candlesticks can help forecast market trends. Let’s dive into bullish and bearish signals.
Indicators Of An Uptrend
Bullish candlesticks shine a light on upward momentum. They show buyers overpowering sellers. Look for these key patterns:
- The Bullish Engulfing: A small bearish candle followed by a larger bullish one.
- The Hammer: A candle with a short body at the top and a long lower wick, indicating rejection of lower prices.
- The Morning Star: A three-candle pattern signaling a trend reversal.
Color also plays a crucial role. Green or white candles suggest positive buyer activity. Size matters too; bigger bodies mean stronger buying pressure.
Signs Of A Downtrend
Bearish candlesticks signal a downtrend. These are moments when sellers rule the market. Key bearish patterns include:
- The Bearish Engulfing: A large red or black candle swallowing a smaller bullish one.
- The Hanging Man: Similar to the hammer but found at the end of an uptrend, hinting at a potential downfall.
- The Evening Star: A bearish counterpart to the Morning Star, predicting a bearish reversal.
Dark-colored candles, especially with long upper wicks, often precede a drop. Larger bodies show intense selling pressure.

Credit: www.dailyfx.com
Common Candlestick Patterns And Their Meaning
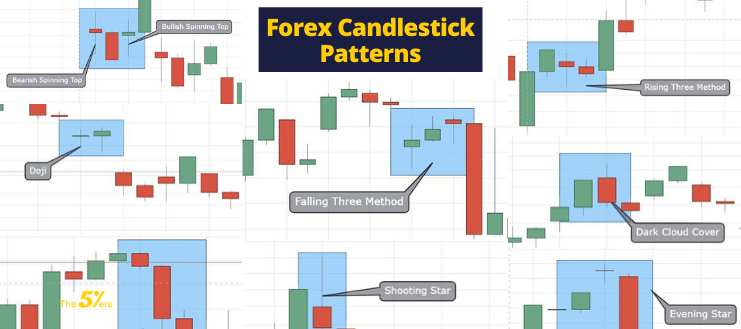
Forex traders often use candlestick patterns to predict market moves. These shapes can tell stories. Knowing these patterns helps traders make smart choices. Patterns like the Hammer, Hanging Man, Engulfing, and Doji reveal market sentiment. This guide uncovers these common patterns and their meanings.
The Hammer and the Hanging ManThe Hammer And The Hanging Man
The Hammer looks like a hammer and hints at a reversal. It suggests that sellers had control but buyers fought back. If it appears during a downtrend, it could signal a bullish reversal.
The Hanging Man also looks like a hammer. It shows up after an uptrend. This may tell traders that buyers are losing grip, and a bearish reversal might occur.
Engulfing PatternsEngulfing Patterns
Engulfing patterns are powerful indicators. They involve two candlesticks.
- Bullish Engulfing: A small bearish candle is followed by a larger bullish candle. It suggests buyers are taking control.
- Bearish Engulfing: A small bullish candle gets covered by a larger bearish one. This hints at growing seller power.
The Doji And Its Variations
The Doji is famous for its “cross” shape, where opening and closing prices are nearly equal. It implies indecision in the market. Various Doji shapes offer different insights:
| Type | Meaning |
|---|---|
| Standard Doji | Neutral; shows balance between buyers and sellers. |
| Long-Legged Doji | Represents greater indecision and volatility. |
| Gravestone Doji | Could indicate a bearish reversal if it appears after an uptrend. |
| Dragonfly Doji | May signal bullish reversal when occurring after a downtrend. |
Strategies For Trading With Candlesticks
Strategies for trading with candlesticks unlock the mystery of market sentiment. Each candlestick shape points to a potential trend change or continuation. Advanced traders use these shapes to predict future price moves. Let’s dive into methods to enhance candlestick trading.
Combining Candlesticks With Other Technical Tools
Pairing candlesticks with technical indicators can confirm signals. For accurate readings:
- Use Moving Averages to spot support and resistance.
- Apply Relative Strength Index (RSI) to gauge overbought or oversold conditions.
- Employ Bollinger Bands for market volatility analysis.
A combination of chart patterns, such as triangles or head and shoulders, with candlesticks, provides a clearer market picture.
Risk Management Using Candlesticks
Risk management ensures the longevity of your trading career. Candlesticks are powerful for risk control through:
- Stop-Loss Orders: Set below or above a candlestick pattern to limit potential losses.
- Position Sizing: Adjust the trade size based on the strength of the candlestick signal.
Monitor candle formations for exits to protect profits or minimize losses.
| Candlestick Pattern | Stop-Loss Placement | Risk Level |
|---|---|---|
| Doji | A few pips beyond wicks | Moderate |
| Engulfing | Outside the engulfed range | High |
| Hammer | Just below the hammer low | Low |
Credit: the5ers.com
Candlesticks In Modern Forex Trading
The art of Forex trading has embraced the visual power of candlesticks. These graphical representations of price movements are not just marks on a chart but stories of the market’s heartbeat. With each open, close, high, and low, traders are given insight into the Forex market’s mood. With today’s technology, candlestick analysis remains a cornerstone of trading strategies.
Software And Automated Charting
Modern traders rely heavily on advanced software to read market patterns. These programs transform raw data into clear candlestick charts. The accessibility of these tools allows novices and professionals alike to make informed decisions.
- Real-time analysis: Traders see the latest price actions instantly.
- User-friendly interfaces: Simplify the complexities of market data.
- Customizable indicators: Personalize strategies with various technical tools.
Automated charting has revolutionized Forex trading. Investors monitor multiple time frames at a glance, uncovering trends and patterns that guide their trades.
Continuing Education And Practice
Becoming skilled in candlestick trading involves ongoing learning and practice. The dynamic Forex market requires traders to stay sharp. Many resources are at their disposal:
- Trading simulators: hone skills without risking real money.
- Webinars and workshops: led by experienced Forex traders.
- Online communities: share insights with fellow traders.
Implementing what’s learned through consistent practice builds the proficiency needed to navigate the often volatile Forex landscape. Candlestick patterns become the language through which traders forecast potential moves.
Credit: www.forextime.com
Frequently Asked Questions For Forex Candlesticks
What Are Forex Candlesticks?
Forex candlesticks are graphical representations of price movements in currency markets, showing the open, high, low, and close values for a specific time period.
How Do Forex Candlesticks Work?
Forex candlesticks illustrate price action within a set timeframe, allowing traders to gauge market sentiment and potential price direction.
What Do Forex Candlesticks Reveal?
Forex candlesticks reveal patterns that indicate bullish or bearish trends and potential market reversals based on past trading activity.
Can Forex Candlesticks Predict Market Moves?
While not predictive, Forex candlesticks can help traders anticipate potential market moves by highlighting trends and reversal patterns.
What Types Of Candlestick Patterns Exist?
Candlestick patterns include single-bar formations like doji and hammer and multi-bar configurations like engulfing patterns and morning stars.
Why Are Candlestick Patterns Important?
Candlestick patterns are important as they help traders make informed decisions by visually depicting market psychology and price momentum.
How Do I Interpret Candlestick Wicks?
Candlestick wicks represent price rejections, with long wicks indicating stronger rejection from high or low levels and potential market turns.
What Time Frames Do Candlesticks Cover?
Candlesticks can cover various time frames, from minutes to weeks, with shorter intervals providing more granular insights into price action.
How To Compare Candlestick Configurations?
Comparing candlestick configurations involves analyzing their sizes, shapes, and positions relative to other candles to identify trends and reversals.
Can Candlesticks Be Used For All Currencies?
Candlesticks can be utilized for any currency pair, offering a universal tool for technical analysis in the Forex market.
Can Forex Candlesticks Help in Identifying Short Term Signals Using Igcs Indicator?
Forex candlesticks play a crucial role in identifying short term forex signals via indicator like IGCS. By analyzing the patterns formed by candlesticks, traders can gain insights into market sentiment and potential price movements. This can be instrumental in making informed decisions for short term trading strategies.
Conclusion
As we wrap up our journey through Forex candlesticks, remember their significance in trading. By mastering these patterns, you can gain invaluable insight into market trends and make more informed decisions. Keep practicing, stay updated, and let candlesticks light your path to forex success.
Happy trading!